In Hurumanu we have been learning about all sorts of graphs and charts, the one I am going to talk to you about is a tally chart. A tally chart is a chart that you use to count things like days here is a photo of one.
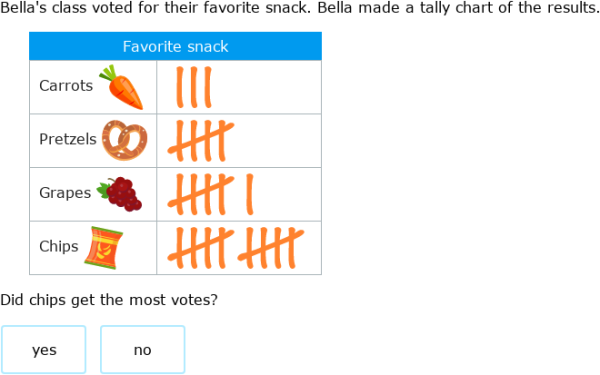
This is what a Tally chart looks like. When you are doing a tally chart you put one line to count as one two lines to count s two lines but when you get to five you go across.
No comments:
Post a Comment
To support my learning I ask you to comment as follows:
1. Something positive - something you like about what I have shared.
2. Thoughtful - A sentence to let us know you actually read/watched or listened to what I had to say
3. Something thoughtful - how have you connected with my learning? Give me some ideas for next
time or ask me a question.